

Client
laundrogrowth
MY ROLE
PRINCIPAL PRODUCT DESIGNER
MY ROLE
WEB APP DESIGN, DATA VISUALIZATION DESIGN
laundrogrowth
designing a robust, data-heavy dashboard for laundromats across the usa

Designing an analytics platform that unified customer data, proved marketing ROI, and helped operators grow revenue across hundreds of stores.
Laundromat operators generate massive amounts of data across payment systems, marketing platforms, loyalty programs, and store operations, but almost none of it exists in one place.
The goal of this platform was to consolidate those fragmented systems into a single intelligence platform that allowed operators to understand customer behavior, marketing performance, and store health in real time.
THe core product problem
The Problem
Running a modern laundromat means managing customer behavior, marketing performance, loyalty programs, and operations across multiple disconnected systems. Operators needed a way to understand what was actually happening across their business without spending hours piecing data together from spreadsheets and dashboards.
Fragmented data
Customer, operational, and marketing data lived across separate systems, making it difficult to get a complete picture of business performance.
Misleading attribution
Marketing platforms reported clicks and form fills, but operators couldn't determine which campaigns actually generated paying, returning customers.
Limited customer visibility
The same customer could appear under multiple loyalty cards or locations, preventing operators from understanding lifetime value, retention, and churn.

"Every system tells me a different story. I just want one place that tells me what's actually happening in my business."
THE CORE CONSIDERATIONS
Turning fragmented data into actionable business intelligence
Designing for multiple levels of decision-making
Building trust in the data
Prioritizing insight over information density
Business Goals
There were several goals that we were looking to achieve with this dashboard
Increase operator visbility
Prove marketing ROI
Reduce churn
Improve customer retention
Create a scalable SaaS platform
Data Architecture
Due to the complexity of the data sets and the sheer amount of data, we started by mapping out the data points and where each of them would exist in relation to their user needs.

Research & Personas
Understanding the people behind the data
Before designing the platform, I identified the primary users responsible for operating and growing multi-location laundromats. Although they shared access to the same data, each role had different goals, priorities, and decision-making needs. This research helped shape the platform's information architecture, navigation, and level of detail surfaced throughout the experience.
Persona
Primary Goal
Needs
Multi-Location Owner
Understand overall business health
Portfolio analytics, revenue, ROI
Regional Manager
Improve store performance
Store comparisons, churn, goals
Store Manager
Operate a single location
Daily KPIs, customer insights, referrals
Marketing Manager
Measure campaign effectiveness
Attribution, CAC, ROAS
Customer Support
Resolve customer issues
Unified profiles, transaction history
Product Strategy
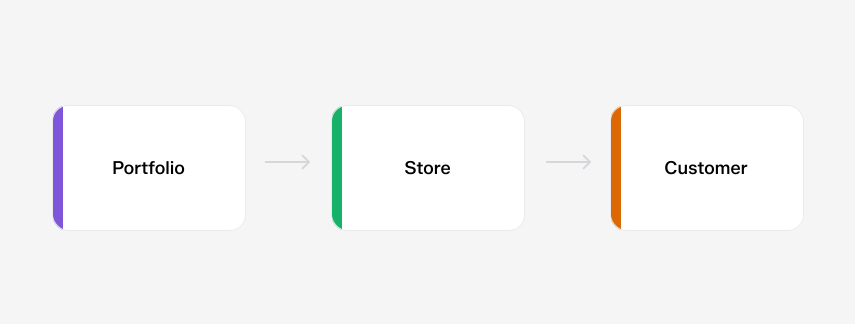
The core strategy for this platform: everything was designed around three layers.
Users should be able to drill down from Portfolio into Store into the Customer from every point in the platform.
Key Screens
Portfolio Dashboard
The Portfolio is a broad overview of all different regions and stores. This is the highest overarching view, and from here a user can drill down into many different views.

Regional Dashboard
From there, a user can drill down into the Regional Dashboard
The Regional Dashboard gives the user a more narrowed view of all stores within a specific region.

Single Store Dashboard
And finally, a user can drill down into the Single Store Dashboard
The Single Store Dashboard shows the user all details about an individual store. There are more drilldown views available from this view.


Marketing Attribution
Marketing Attribution

Customer Journey Analysis
Customer Journey Analysis

Customer Profile
Customer Profile

Outcome
This designed enabled operators to:
View portfolio performance from one dashboard
Identify customer churn earlier
Understand true marketing ROI
Unify fragmented customer identities
Measure store performance consistently
0
0
Weeks
From the beginning of the process to the finished MVP to be presented to investors
0+
0+
Business Metrics Organized
Transforming fragmented operational, customer, and marketing data into a single decision-making platform.
Reflection
This project reinforced that analytics products aren't about visualizing data, they're about reducing uncertainty. Every dashboard, chart, and workflow was designed around helping operators answer a business question faster and with greater confidence.